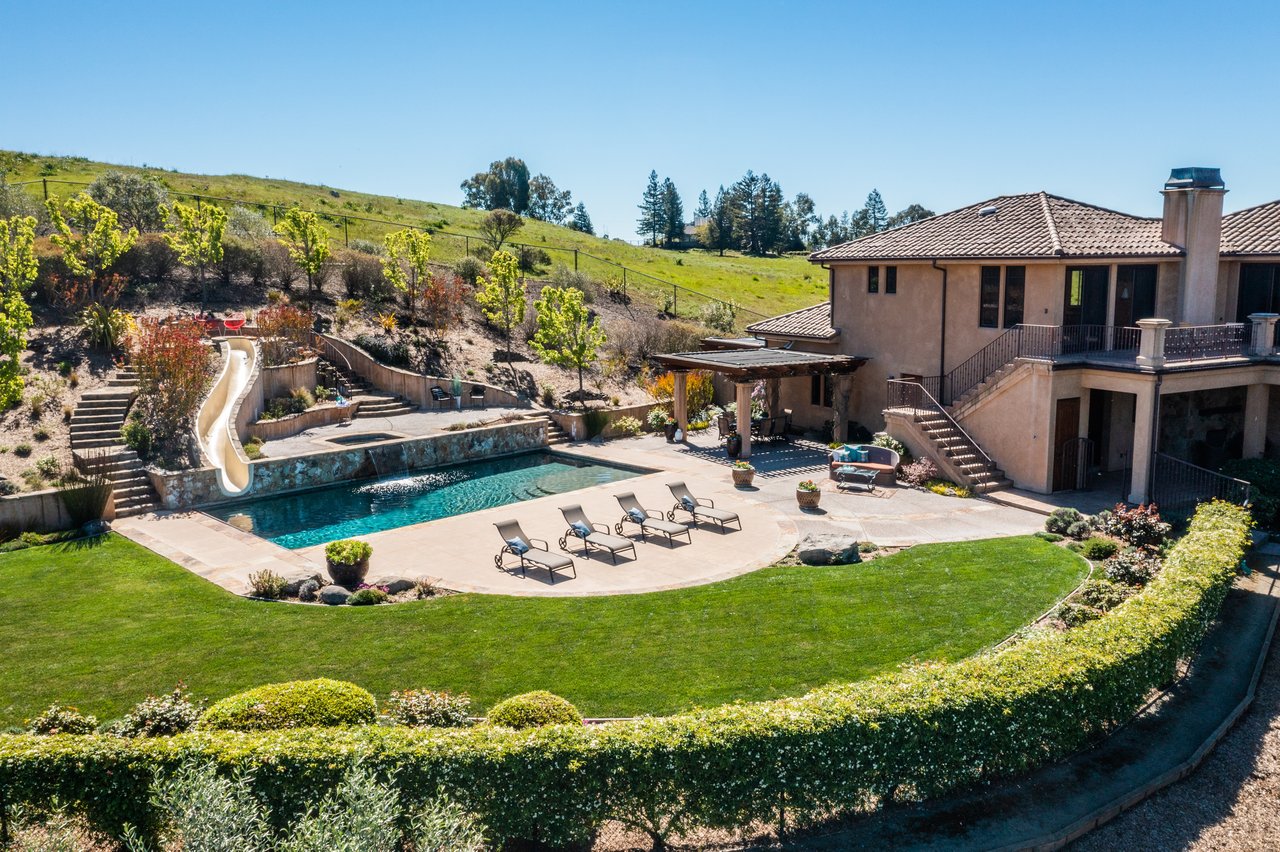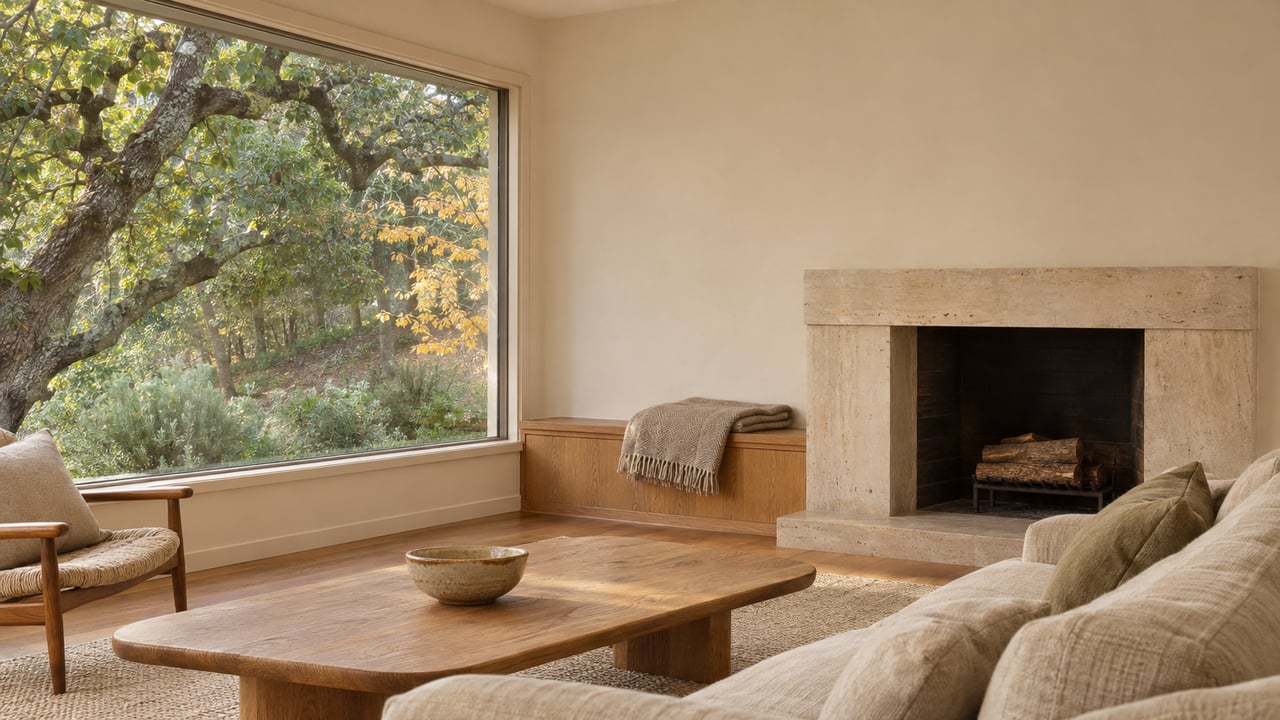
On July 15, a four-bedroom house built in 1957 at 7 Haciendas Road in Orinda sold for $9,950,000. It has 9,082 square feet. On August 19, a nine-bedroom house built in 1928 at 8 Camino Lenada sold for $9,000,000. It has 7,987 square feet. Both sales closed in the same quarter, and that quarter is the one now quoted to anyone asking whether Orinda prices are climbing.
From July 1 through September 30, 2026, Orinda's average single-family sale price was $2,378,031. A year earlier it was $2,031,605. That is a 17% increase. If you are deciding between Orinda and Lafayette, it reads like a reason to hurry. The sale-by-sale record points the other way. For most of the summer, Orinda was the town in this corner of Contra Costa where buyers had the most room to negotiate.
Two estates account for the jump
According to Lamorinda Weekly's third-quarter review, which draws on Contra Costa Association of Realtors figures, 53 single-family homes closed in Orinda between July 1 and September 30, 2026. At a $2,378,031 average, those sales total about $126 million. The two estates make up $18.95 million of that.
Take those two out and the other 51 sales average about $2.10 million. That figure is our own calculation from the reported total, not a published one. It is roughly 3% above the full third-quarter 2025 average. That is a modest increase for a typical Orinda house, nothing like 17%.
Price per square foot supports the same reading. Orinda's third-quarter 2026 average was $746.18, down from $755.76 in the summer of 2025. Both estates sold well above $1,000 a square foot. The Haciendas Road house works out to about $1,096 and the Camino Lenada house to about $1,127, so they pulled that average up. Even with their help, Orinda's per-square-foot figure fell from a year earlier, which means the rest of the summer's sales were softer than the headline number makes them look.
Asking prices held up less firmly in Orinda
The clearest evidence comes from comparing each sale price with the final asking price. In the third quarter of 2026, Orinda homes sold for an average of 98.5% of final asking, down from 99.3% a year earlier. Lafayette homes sold for 101% of asking, the same as in the third quarter of 2025.
| July 1 to Sept. 30, 2026 | Orinda | Lafayette |
|---|---|---|
| Single-family closings | 53 | 84 |
| Average sale price | $2,378,031 | $2,112,426 |
| Average price per sq ft | $746.18 | $835.62 |
| Sale price vs. final asking | 98.5% | 101% |
| Sold at or above asking | 26 of 53 | 52 of 84 |
| Average days on market | 29 | 22 |
In Orinda, 26 of the 53 sales closed at or above asking, slightly under half. A year earlier the count was 32 of 64, so Orinda's share has held close to 50% for two summers. In Lafayette, 52 of 84 sales reached asking or better this quarter, and in Moraga it was 18 of 29. Both work out to about 62%. Over a third-quarter 2026 sample of 53 homes, Orinda buyers were about as likely to pay less than the asking price as to pay it.
In the same review, Conrad Bassett offered an explanation. Rising rates played a part, along with "sellers realizing that they needed to be more realistic in pricing and buyers understanding that there were fewer buyers to compete with so they were not as aggressive in their offers." The review gives Piedmont for comparison, where the average sale from July through September closed about 25% above asking. In practice, an Orinda asking price this summer was close to the real number, and often a little above it.
Lafayette's numbers moved the other way. Its average sale price fell to $2,112,426 from $2,218,412 a year earlier, yet it had more closings, homes sold faster at 22 days on average, and sales still cleared asking. A lower average combined with stronger offers suggests a market where competition stayed intact while the mix of homes sold shifted toward smaller ones. Orinda shows the reverse: a higher average made up mostly of two estates, with offers that were less aggressive.
What $1.1 million to $1.4 million bought in each town
Averages blur what a buyer actually pays for, so here are individual sales at the entry point of each town, as they appear on Lamorinda Weekly's recorded-sales lists for this summer.
| Town | Address | Price | Sq ft | Year built | Sale date shown |
|---|---|---|---|---|---|
| Orinda | 1 Haciendas Road | $1,193,500 | 1,513 | 1938 | 07-15-26 |
| Orinda | 79 California Avenue | $1,200,000 | 1,421 | 1964 | 06-09-26 |
| Orinda | 26 Fern Way | $1,250,000 | 1,844 | 1968 | 09-11-26 |
| Orinda | 163 El Toyonal | $1,360,000 | 2,295 | 1973 | 09-02-26 |
| Orinda | 208 Ivy Drive | $1,375,000 | 2,149 | 1954 | 09-02-26 |
| Lafayette | 3384 Deer Hill Road | $1,128,000 | 1,999 | 1947 | 05-29-26 |
| Lafayette | 980 Hawthorne Drive | $1,150,000 | 1,748 | 1942 | 08-14-26 |
| Lafayette | 3314 Beechwood Drive | $1,150,000 | 1,296 | 1941 | 09-30-26 |
| Lafayette | 3320 Deer Hill Road | $1,250,000 | 1,608 | 1952 | 06-09-26 |
| Lafayette | 3342 South Lucille Lane | $1,250,000 | 1,154 | 1954 | 08-04-26 |
These ten sales line up with the quarterly figures. At around $1.2 million to $1.4 million, the Orinda examples run from about 1,400 to 2,300 square feet, and two of them top 2,100. The Lafayette examples cluster lower, with 3342 South Lucille Lane at 1,154 square feet for $1.25 million. Orinda's $90-per-square-foot gap with Lafayette in the third-quarter averages, multiplied across a 2,000-square-foot house, comes to about $180,000.
Most of those houses on both sides were built between the 1940s and the 1970s, so Orinda's per-square-foot advantage mostly applies to older houses. Newer construction in Orinda sells at a different rate. 38 Fiddleneck Way, built in 2021, sold on July 21 for $3,050,000 at 2,736 square feet, about $1,115 a square foot. 42 Charles Hill Circle, built in 2025, sold on September 30 for $5,450,000 at 4,657 square feet, about $1,170 a square foot. A buyer comparing the two towns on per-square-foot price is largely comparing the ages of the houses that sold.
Fall started with fewer listings and lower rates
The summer figures describe a market that has already started to shift. As of October 6, 2026, Orinda had 33 homes for sale, down from 56 at the same point in 2025. Lafayette had 49, down from 67, and Lamorinda as a whole had 115, down from 161. Orinda's inventory fell about 41% year over year, a steeper drop than Lafayette's roughly 27%.
Orinda buyers had room to negotiate this summer partly because more homes were available and rates were rising. Both of those conditions have changed. Freddie Mac's weekly 30-year fixed average reached 7.40% on October 15, then fell four weeks in a row to 7.11% on November 12. Across Orinda, Lafayette and Moraga, 47 sales were pending as of October 6, and seven of them took acceptable offers in the first six days of the month.
Bassett also identified buyers coming in from Oakland, San Francisco, Silicon Valley and the Peninsula with more equity to spend, as well as an increase in corporate relocation as remote workers return to their offices. Those buyers had been competing for 56 Orinda listings a year ago. This fall there were 33.
For a buyer choosing between the two towns, the summer record supports a few practical points. On a typical Orinda house, the asking price was a starting point for negotiation more often than in Lafayette. Orinda's lower price per square foot showed up in the older houses that made up most of its sales. And the conditions that produced that room, more listings and rising rates, were both weaker by mid-November than they were in July.
Questions buyers ask about Orinda right now
Did Orinda home prices go up in 2026? The average did, from $2,031,605 in the third quarter of 2025 to $2,378,031 in the third quarter of 2026. Without the two sales of $9 million or more, the rest of the quarter averages about $2.10 million, and price per square foot fell from $755.76 to $746.18 over the same period.
Is Orinda less expensive than Lafayette? By the average sale price in the third quarter of 2026, no. By average price per square foot in the same quarter, Orinda was lower at $746.18, compared with $835.62 in Lafayette.
How long did Orinda homes take to sell? An average of 29 days in the third quarter of 2026, compared with 33 days a year earlier and 22 days in Lafayette this summer.
When an average depends on two estates, a house's value comes from the sales that resemble it, such as 26 Fern Way and 208 Ivy Drive, not from the headline figure. If you own in Orinda or Lafayette and want to know where your house sits among this year's comparable sales, Lauren Kraus can walk you through those sales. Request your complimentary home valuation.